Our upcoming feature release next week is dedicated to swimmers. Finally you can unlock all the data your Garmin Swim, Forerunner 910XT or 920XT gathers while you swim indoors - in a way that is easy to understand and helps you make actual improvements in your swim technique.
It also means pool workouts just got a whole bunch of new metrics. If you're new to technical analysis of your swim workouts, this article will quickly get you up to speed. Once you get the basics down, you'll be on your way.
Did my computer just taste the rainbow?
After you've finished a pool workout and uploaded it to SportTracks, bring up the details page and click over to Intervals tab. You should see something like this:
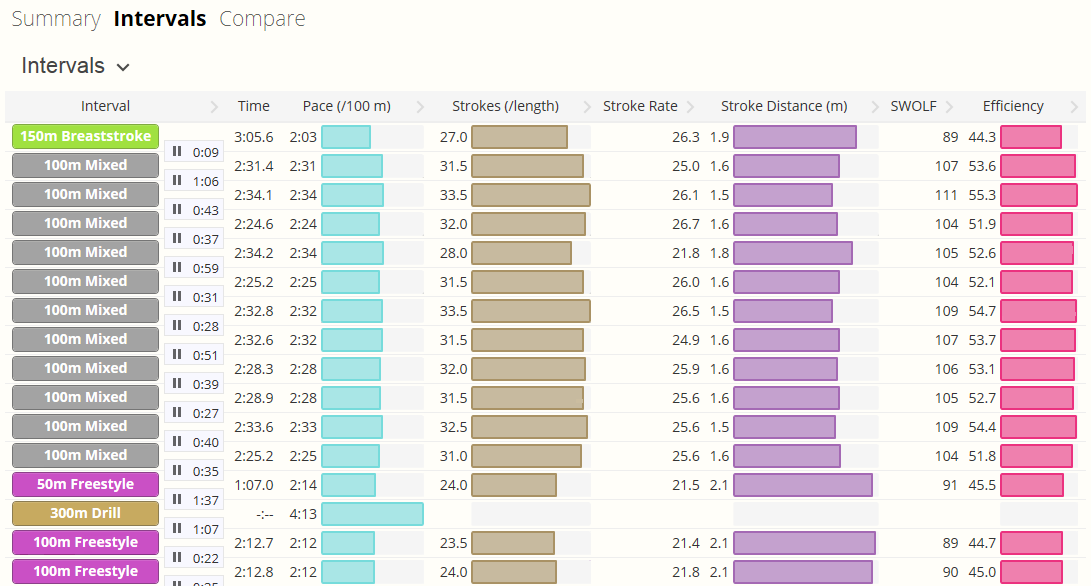
Wow right?! If you don't see the bar charts (and want to), just click the table header to cycle through the column styles. This feature works on all the interval tables (not just pool workouts!). From the left:
Interval
Shows the distance, stroke type and repetitions (for sets), followed by the rest time after the interval.
Time
Do I have to explain this? C'mon.
Pace
Light blue: Pace during the interval. Faster is better, obviously. You can compare performance across different lengths during a single interval, or see how different intervals compare early in the workout vs. later.
Strokes
Brown: The number of strokes you took to complete the interval. We recommend switching to the "per length" option since probably your interval/set distances will change, the total strokes become less useful. Less strokes is more efficient.
Stroke Rate
Green - not expanded: The number of strokes you take per minute. If you're a runner, this is your foot stride turnover. If you're a cyclist this is your pedaling cadence. Just like those, there is no "higher is better" rule, so it is useful to understand your personal optimal stroke rate while looking at other metrics (such as speed and stroke distance). Also useful to compare to openwater swims where you have stroke rate, but no pool length.
Stroke Distance
Purple: The distance you covered in each stroke. Now we're getting into some interesting metrics. While stroke rate tells you how fast your arms are moving, stroke distance tells you how much all that effort is getting you across the water itself. An easy metric to understand, for any given stroke rate a higher stroke distance will be better - you're getting more pull out of each stroke.
SWOLF
Orange - not expanded: SWOLF is an abbreviation for SWim gOLF. Your SWOLF score is (number of strokes) + (number of seconds) for a pool length, so just like golf, a lower score is "better".
SWOLF predates the new gadgets that collect all this data for you. It is easy for a coach to count while watching a swimmer with just a stopwatch. Now we've got gadgets we can calculate better metrics (like stroke distance). Still, SWOLF is nice because it is a "combined metric" of speed and effort. Which leads to...
Efficiency
Red: SWOLF per 25 meters. If you think about the raw SWOLF score above you'll quickly notice a 25m vs 50m pool will have completely different values! Efficiency fixes this problem, so you can compare apples-to-apples in different pool lengths. If you sometimes swim in a 25 yard pool, and sometimes in a 50 meter pool this is what you'll want to look at. And you don't have to do all the fancy math in your head - we take care of that.
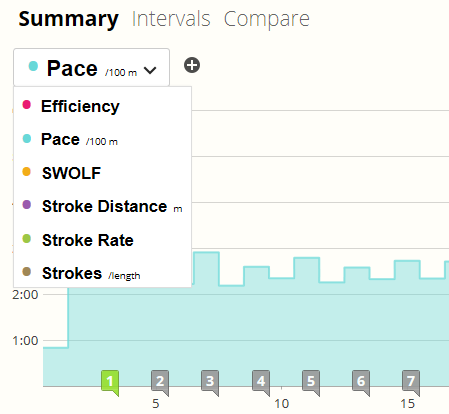
Viewing pool data on charts
The same data options in the intervals page are also available in the charts, along with multi-metric overlay, the possibility to hover over intervals and sets for summary performance numbers, and of course dragging selection to see a particular section of your workout. Just click the chart metric selection button or (+) to add overlay metrics.
How do I use all this to get faster?
You'll see another post in the next week with tips on using all this data to make actual performance improvements. Until then, here is an interesting article from our friends at Steel City Endurance which will make a lot more sense with your pool data in front of you.
If you want to use these advanced pool metrics you'll need a watch capable of recording strokes. Any of these options will work, click for details and reviews:
- Garmin Swim
- Garmin Forerunner 910XT
- Garmin Forerunner 920XT
- Garmin Fenix 2
- Garmin Fenix 3
- Suunto Ambit 2
- Suunto Ambit 3
- TomTom Multi-Sport
Comments
What about those of us with a tom-tom multisport - will we be able to get our metrics into SportsTracks.mobi?
Aaron, great great work!! Thank you for taking into consideration some of our suggestions. I'm really enjoying it!!
WIll this also work for the Fenix 2?
Will you be able to edit things like strokes that are recorded incorrectly?