Training specificity is a key principle of performance training. That means targeting a specific performance zone, whether that is pace, speed, power or heart-rate, and sticking to that zone for an intended duration.
So how do you validate whether you stayed in your target zones after the workout and if you need to tweak your training? If you want to know the time you spent in training zones for the entire workout you can look at the charts on the analysis tab of the workout details. But for workouts with mixed intensity periods — such as intervals, or hill training, etc. — this doesn't tell you all the details you need.
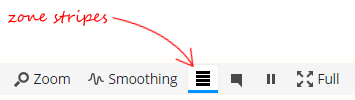
Now you can quickly view which performance zone you're in during specific periods of a workout by enabling zone striping in the chart. To turn on the zone striping feature click the zones button in the chart toolbar:
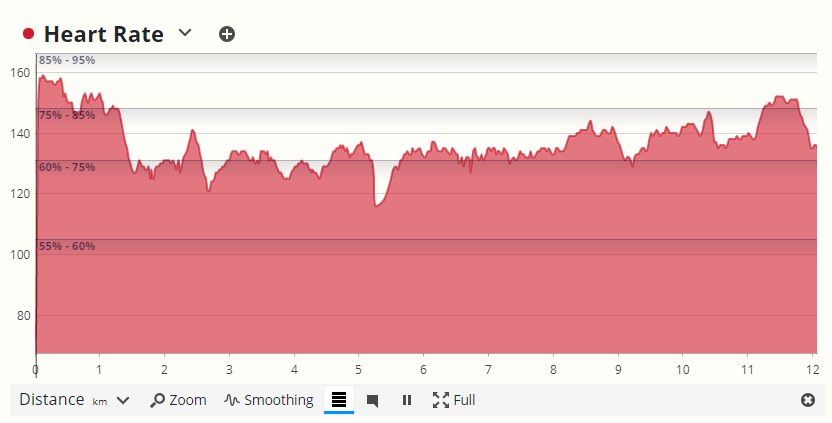
Enabled zones will be shown for the first metric you've selected in the chart:
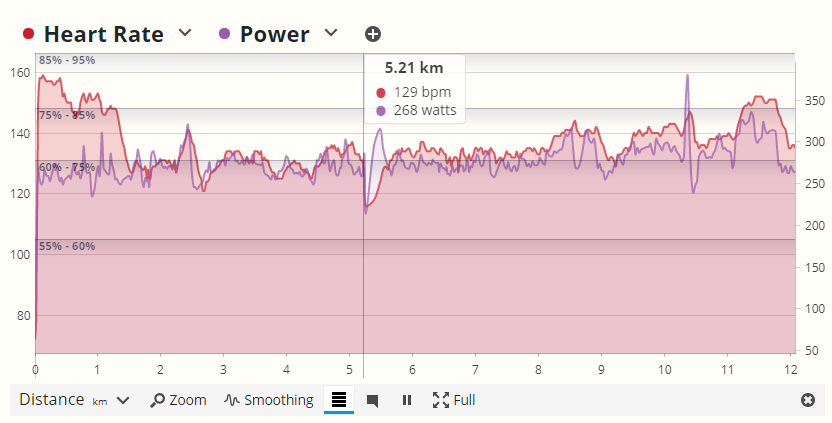
You can still use the chart overlay features if you want to view zone information versus other metrics, for example the elevation, grade, or power changes:
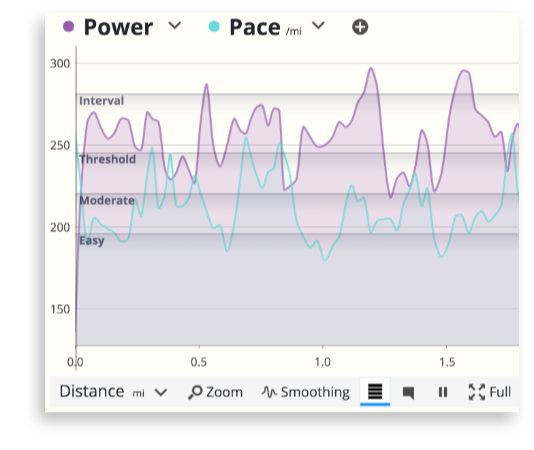
You can always adjust your zones by selecting your profile picture in the right corner, then selecting My Account, and then hitting the Training Options tab on the left. Here you can make custom zones for running, cycling, swimming, or any other sport, and create zones for speed, heart-rate, power, and cadence. You can add or remove the number or zones for each metric, customize the range of each zone, and give them unique names. The names you choose will be displayed in your zone stripes:
Thats all there is to it. Enjoy this new feature!
Comments
A great and much appreciated addition! Thanks!
Great feature. Easy to check for matches. Can you make it stand out a bit more - lt's a bit faint compared to the red of the heart rate and purple of power.
Can I edit grade zones?
Hurray! I've been looking forward to this feature for quite a while. Thank you!
An excellent feature and well implemented! I really like the gradients, they make it super easy to read.
Hi. OK with "Arctic" theme, but not shown clearly with the "Indigo"...
Is it possible to alter colours in the graphs etc.? As a colourblind user of Sporttracks, much of this is difficult to use.
I don't understand one thing. You start an easy workout, you feel strong and you decide to put some fartlek sessions in. You get on sporttracks but you cannot do something very important. you cannot highlight the segments you did fartlek and you cannot put a note on them for future reference and PE assessment. To schedule a workout is one thing. To dynamically change and assess a running session is another....... Would it be so difficult to make this addition?
Please don't reply by mentioning that I can highlight and edit laps etc. I don't mean that. I would like to be able to highlight, isolate and comment on any segment I feel it is important for the training phase. thank you